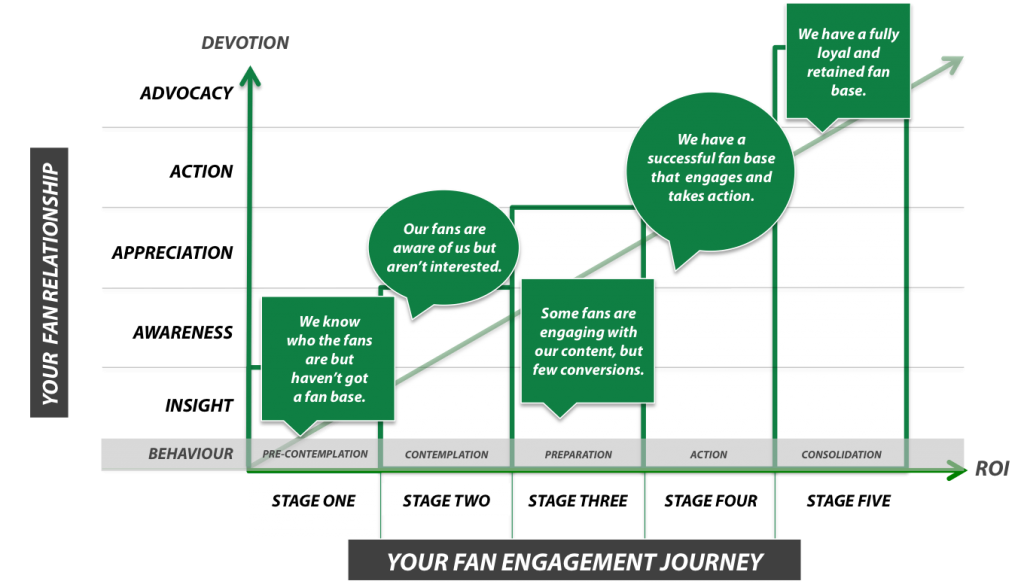
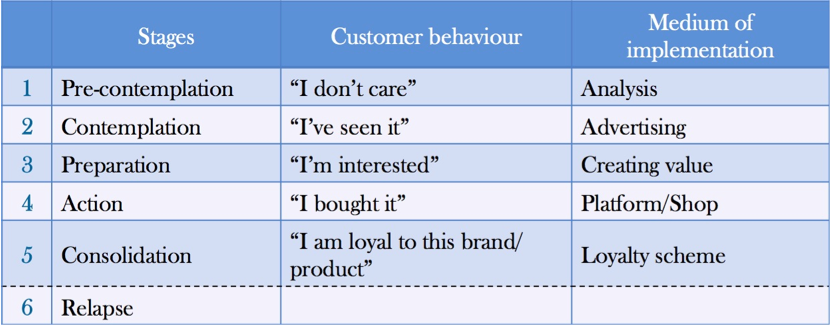
Two years ago, just as We Play was born I created a scale that aligned the behaviour change cycle (you know the one used to help people quit smoking, loose weight, stop gambling) with the realm of fan engagement and social media.
I had spent a fair amount of time researching into gamification; how game mechanics can drive behaviours and brainstorming ways in which behaviour triggers can influence a sports fanbase and their actions towards brands.

The original Fan Engagement Journey

Part of a consultancy session where I discussed the model
The chart became a cycle that we used to determine the level of loyalty through fan participation, each of our strategies had achieved.
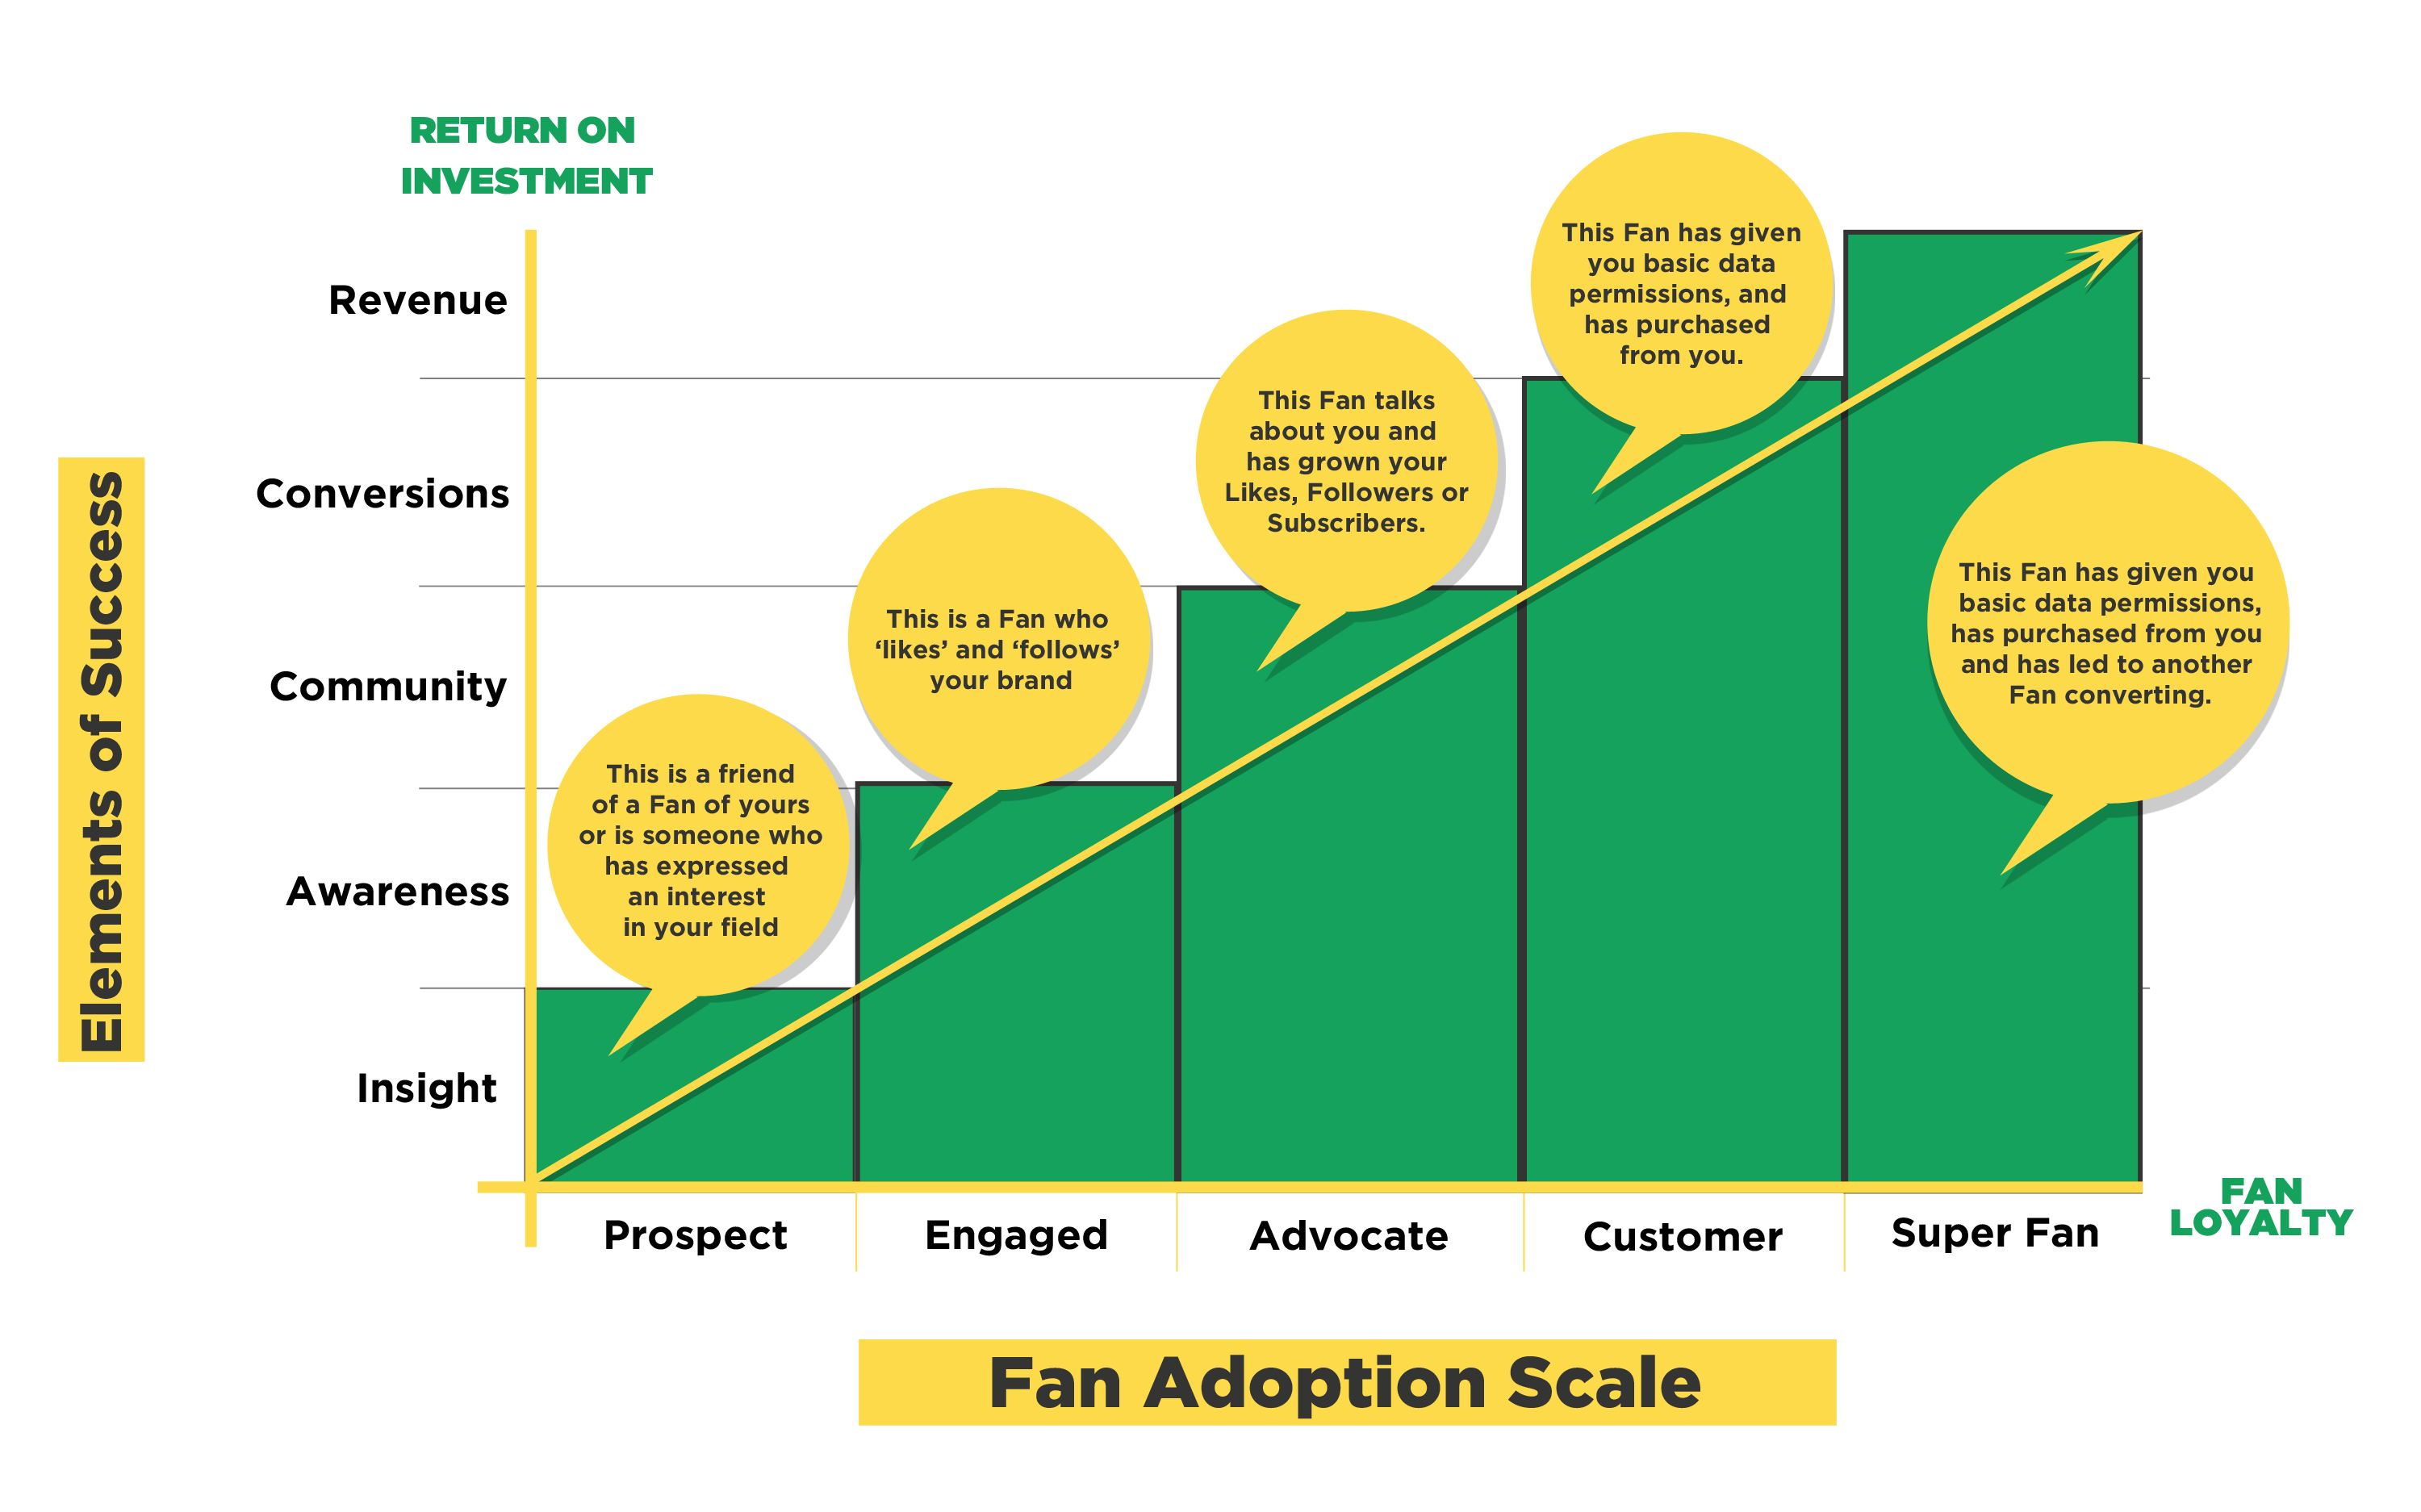
It’s now time to release an updated version of the scale, with what has been two years of experience in understanding the behaviours of brands and their fans.
As a digital consultancy specialising in sport, our role is to deliver value on both sides of the spectrum. To leverage our clients’ business in ways that communicate with their target audience. To deliver an experience to sports fans, through mediums that they are comfortable in using.
Some points to consider when viewing the chart:
- There is no specific timeline
- There are no metrics or values to assign to each stage
The chart maps three things:
- The elements of success, deemed by the objectives our clients seek with their digital strategies
- The level of adoption from our target audience to each brand
- The description of the stage, explaining in brief the actionable metrics, tracked by the fans of our clients at each stage in the journey

Fan bases are fragmented, so this model should not be used to assume that whole fan bases can be placed into one pigeon hole on this chart. The model acts as a visual to assist in the assessment and planning stages that occur throughout the strategic process.
I welcome any feedback and would love to discuss with other marketeers or strategists that are interested in this model or simply the brand and fan adoption journey.

